QR Code Barcodes with SQL Server Reporting Services SSRS
How to create barcodes in SSRS using BarCodeWiz QR Code Fonts
- This tutorial shows how you can add QR Code 2D barcodes to SQL Server Reporting Services.
- See the video or simply follow the steps below.
Before You Begin
- Ensure BarCodeWizFonts.QrCode.dll, as well as the font files, are installed on the server.
- See BarCodeWiz Fonts in SSRS - Installation
Step 1. Configure Report Properties
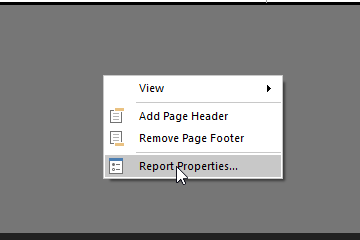
- Open Properties Window - right-click in the report background area and click Report Properties...
Add Reference:
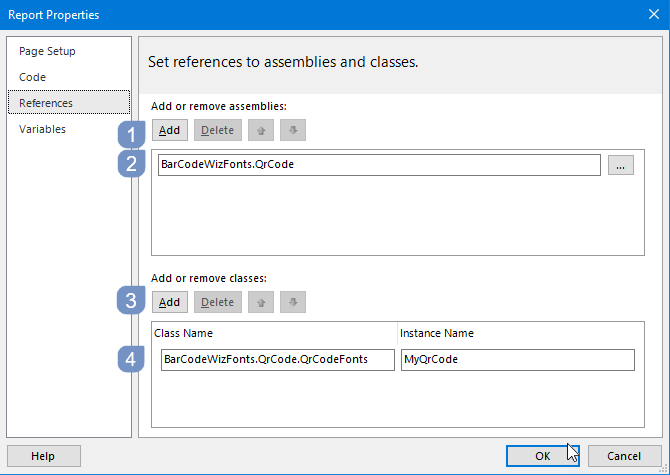
- In the Report Properties window, select the References section.
- 1) Click Add to add the assembly.
- 2) Type: BarCodeWizFonts.QrCode.
- 3) Click Add to add a class instance.
- 4) Type BarCodeWizFonts.QrCode.QrCodeFonts for class name and MyQrCode for instance name.
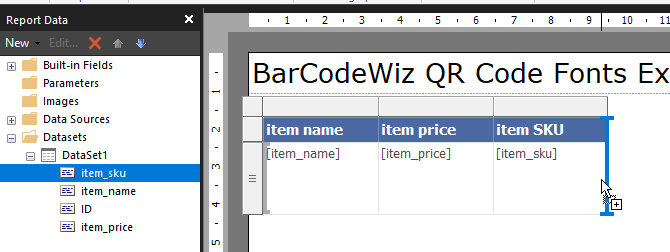
Step 2. Insert a Text Box
- Insert a text box into the report by dragging one of the columns from your DataSet.
- In this example, the text box is placed inside a Table
Step 3. Edit Text Box Properties
- Right-Click > Expression...
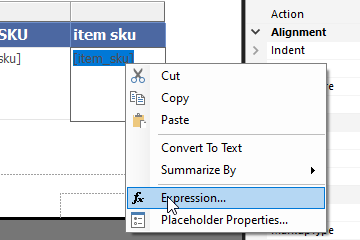
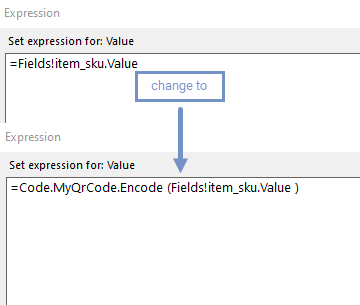
- Edit the expression as shown
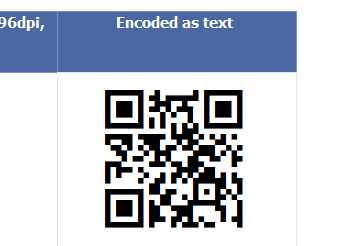
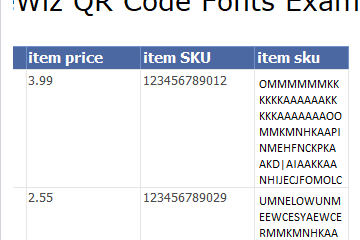
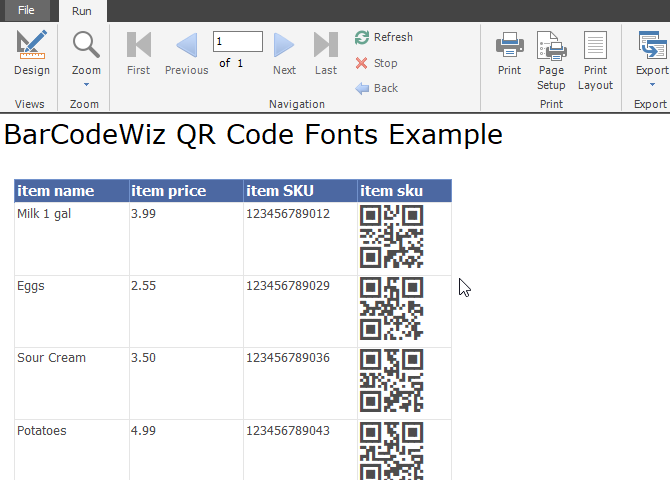
- Let's preview the report. It should look like this:
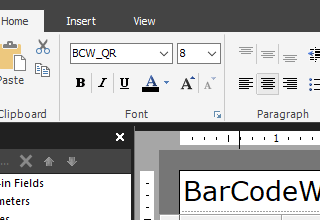
Step 4. Set Font Properties
- Set Font Name to: BCW_QR
NOTE: For smaller barcodes, you can set the point size as low as 2pt
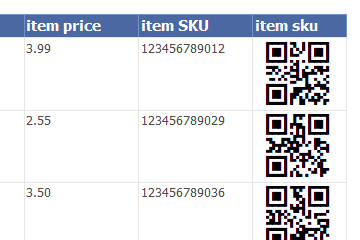
The Result
- The report is now ready.
Combine Data from Two or More Fields
- Two fields separated by space:
=Code.MyQRCode.Encode( Fields!item_sku.Value + " " +
 Fields!item_name.Value)
- Two fields separated by comma:
=Code.MyQRCode.Encode( Fields!item_sku.Value + "," +
 Fields!item_name.Value)
- Two fields separated by TAB (ASCII code 009):
=Code.MyQRCode.Encode( Fields!item_sku.Value + "^009" +
 Fields!item_name.Value)