Interleaved 2 of 5 Barcodes in RDLC Reports
Generating Reports with Interleaved 2 of 5 Barcodes in Visual Studio
- This tutorial shows how you can add Interleaved 2 of 5 barcodes to Visual Studio RDLC Reports.
- Watch the video or follow the steps below.
Before You Begin...
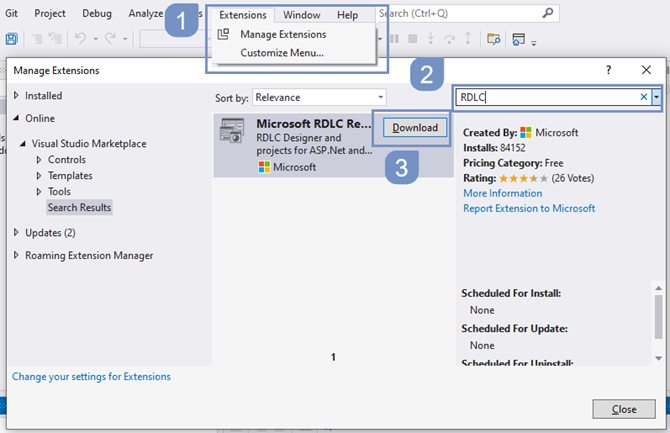
- Make sure you've got Microsoft RDLC Report Designer installed.
- (1) To install it, go to Extensions / Manage Extensions
- (2) Type RDLC in the search field
- (3) Click Download
- Proceed with installation.
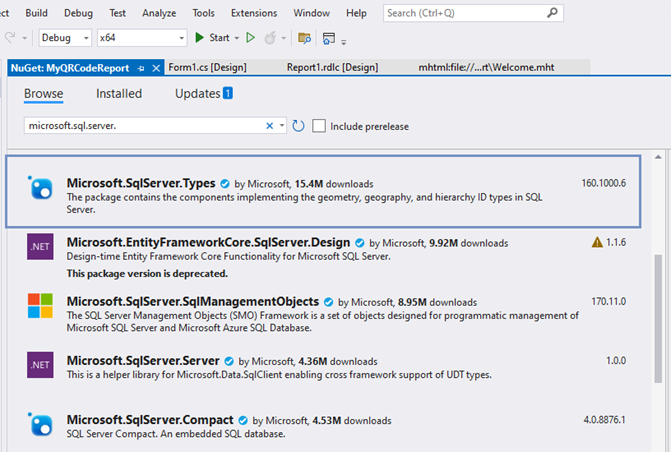
- Check if you have Microsoft.SqlServer.Types installed.
- Otherwise, go to Project / Manage NuGet Packages...
- On the NuGet window search for Microsoft.SqlServer.Types
- Click on Install and follow the installation wizard
Step 1. Create a new Project
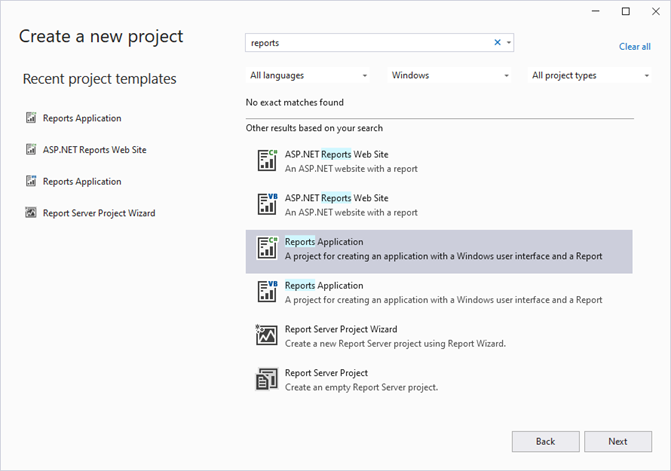
- In the main Visual Studio window, select Create a new Project
- Type Reports and select Reports Application (in our case C# project)
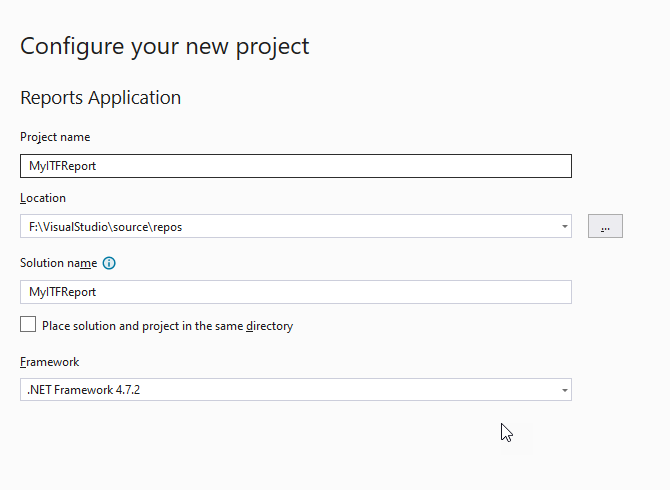
- Name your project
- Select the Framework that you plan to use
- Click on Create
Step 2. Bind a Data Source
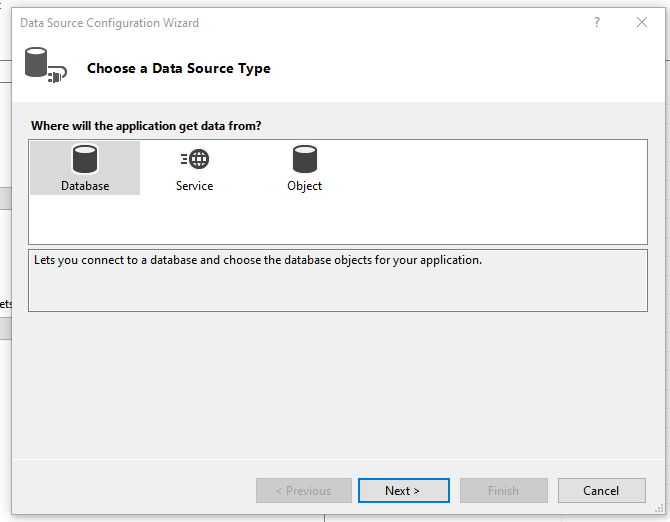
- Select the Data Source Type that you would like to use in your reports (in our case it will be Access Database )
- click on Next
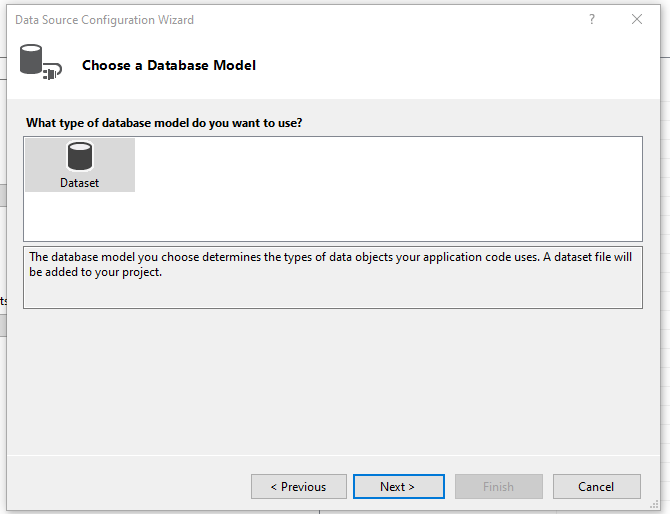
- Select Dataset for the database model and click Next
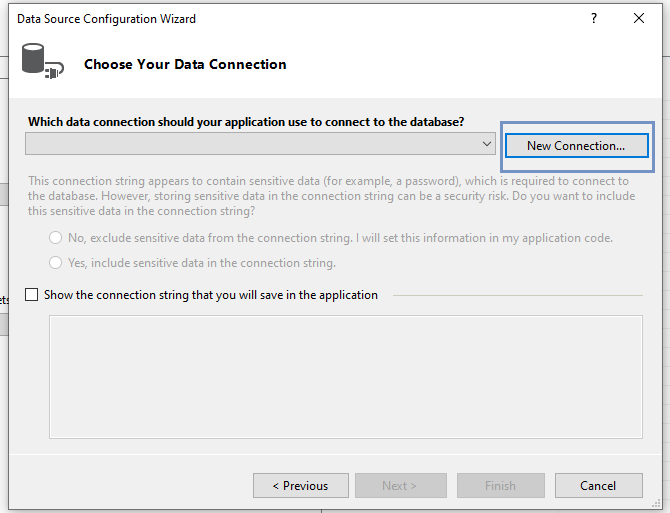
Click on New Connection...
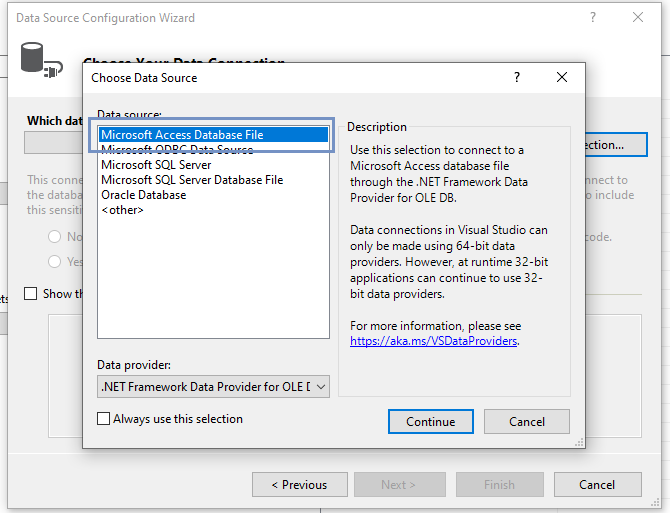
- On the Choose Data Source screen, select Microsoft Access Database File and click on Continue
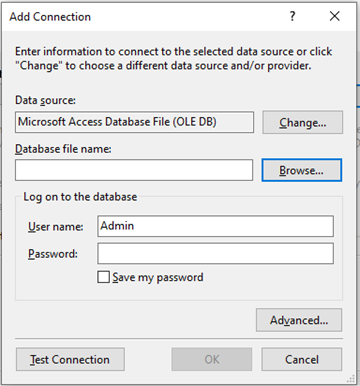
- On the Add Connection screen click on Browse...
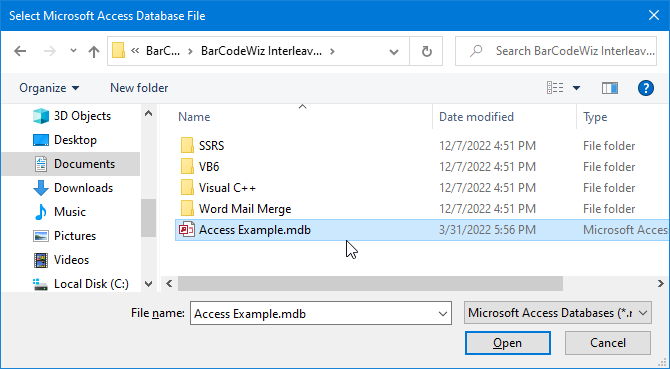
- On the Select Microsoft Access Database File screen, browse to the folder Documents\BarCodeWiz Examples\BarCodeWiz Interleaved 2 of 5 Fonts and select Access_Example.mdb
- Click on Open
- On the Add Connection screen, click OK
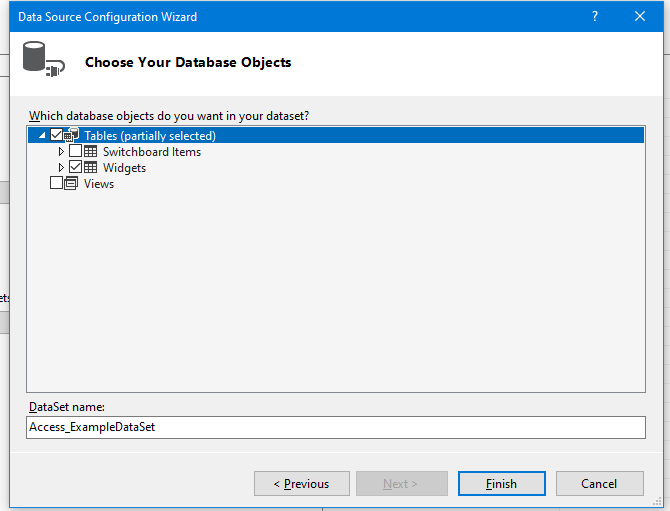
- Select Tables to use in the Report
- Click on Finish
- Click on Next on the next screen (Dataset Properties)
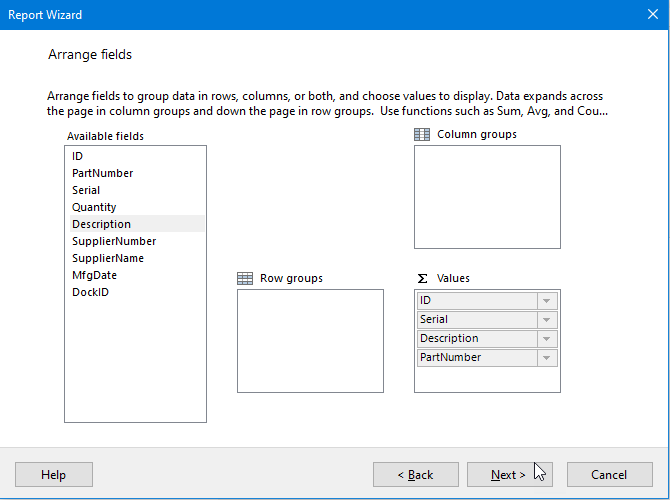
- Arrange fields for the report.
- In our case, we have placed all the fields in the Values section without summarizing.
- Click on Next on the next screen (Choose the layout).
- Click on Finish on the screen named Preview.
Step 3. Setting up the Source of the Report's Definition
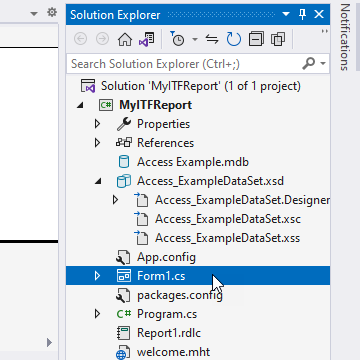
- Double - click Form1.cs in Solution Explorer
- Configure Data Sources:
- Bind your Report with Form1
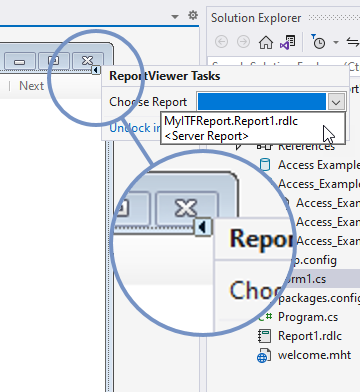
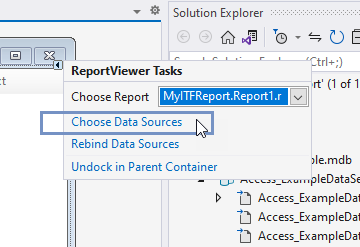
- Click on the tiny triangle just below the Close button
- Select MyITFReport.Report1.rdlc
- Click on Choose Data Sources
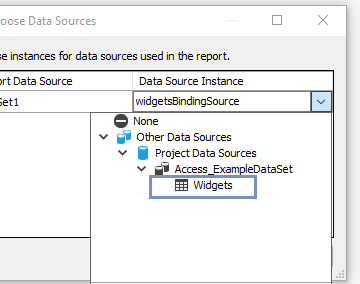
- Expand available sources and select the one you configured earlier.
- In our case - Widgets
Step 4. Changing the Project Platform to x64
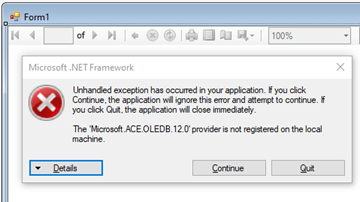
- If you Start your Project now, you would receive an error saying there is no OLEDB driver for ACCESS files on the machine.
- To prevent that, we have to switch the debug to x64 processors.
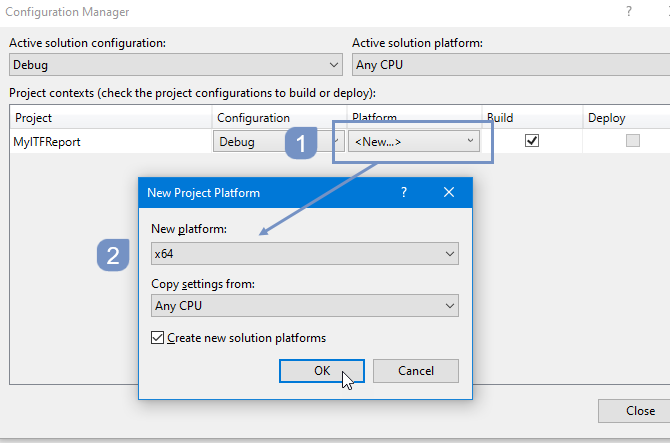
- Go to Configuration Manager...
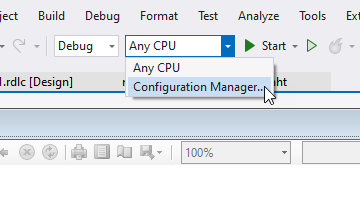
- (1) In the Configuration Manager window, select New from the list under Platform
- (2) In New Project Platform, select x64
- Click OK and Close
Step 5. Add reference to BarCodeWizFonts.ITF.dll
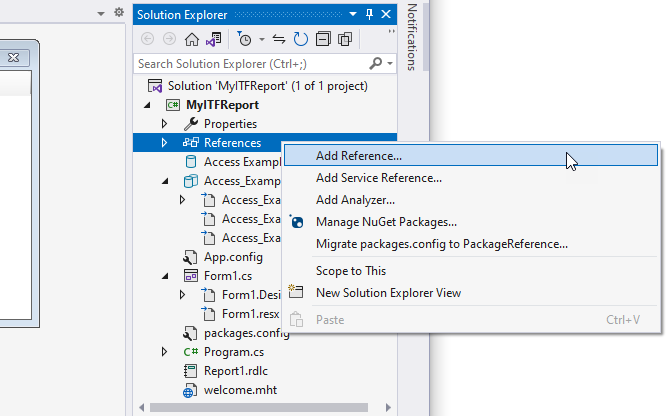
- In Solution Explorer right-click on References
- Select Add Reference...
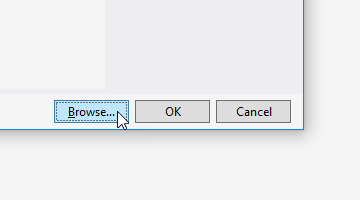
- In Reference Manager click on Browse.
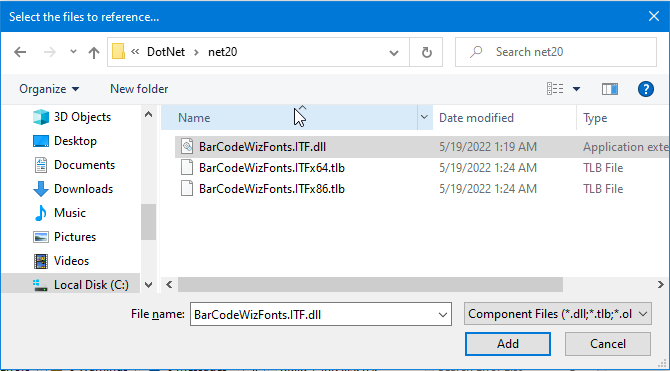
- In the Select the files to reference window, browse to folder Program Files\BarCodeWiz\BarCodeWiz Interleaved 2 of 5 Fonts\DotNet\net20 and add the file BarCodeWizFonts.ITF.dll
- Click OK in the Reference Manager window.
Step 6. Configure Report Properties
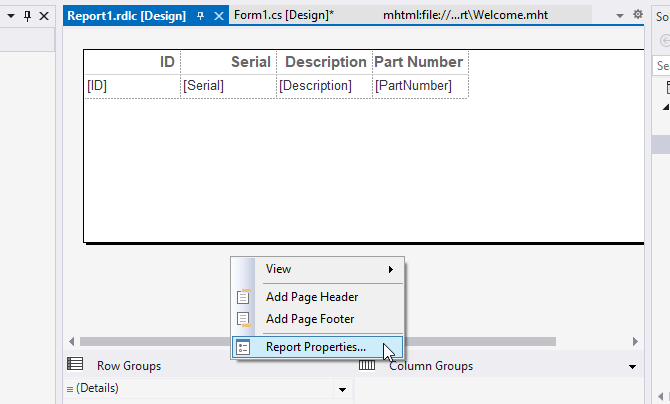
- Right-click on the empty area of Report1.rdlc and select Report Properties
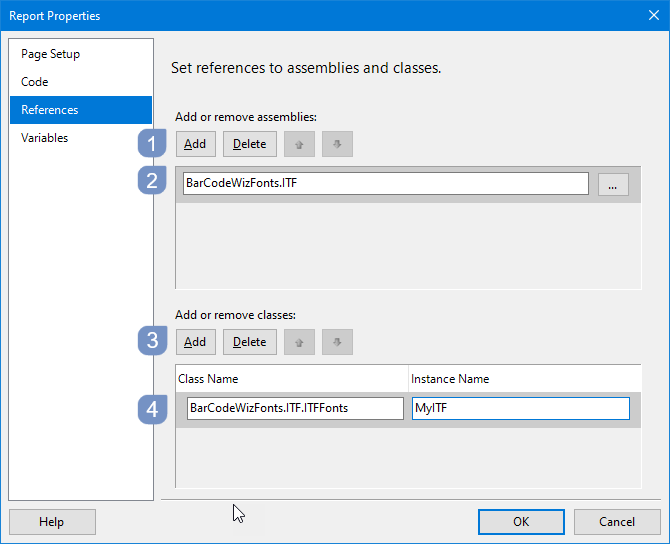
- In the Report Properties window, select the References section.
- 1) Click Add to add the assembly
- 2) Type: BarCodeWizFonts.ITF
- 3) Click Add to add a class instance
- 4) Type BarCodeWizFonts.ITF.ITFFonts for class name and MyITF for instance name.
Step 7. Insert a new column with data to encode
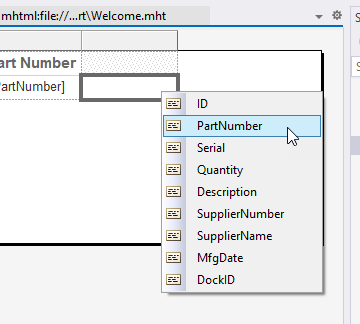
- Right-click on the last column's header and select Insert Column - Right.
- In the new column, click in the upper-right corner and select the column with the data you wish to encode (in our case - PartNumber)
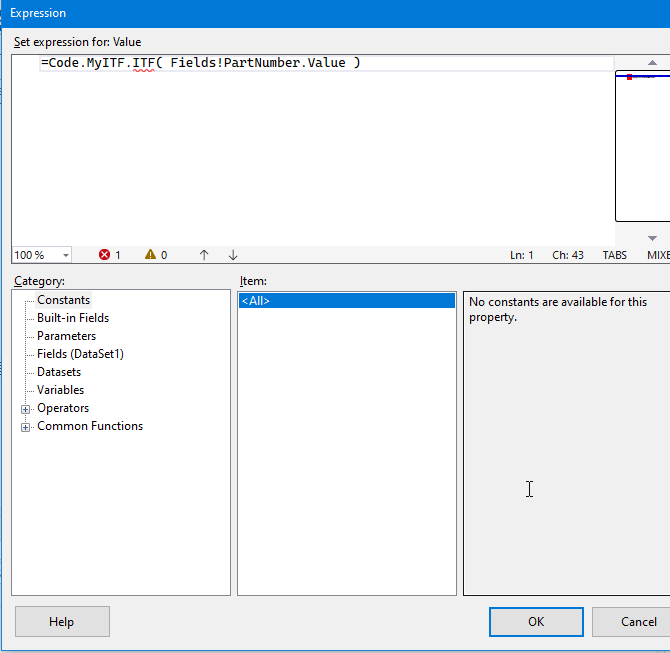
Step 8. Edit the Expression
- Right-click on the column with the data to encode (item_name) and select Expression
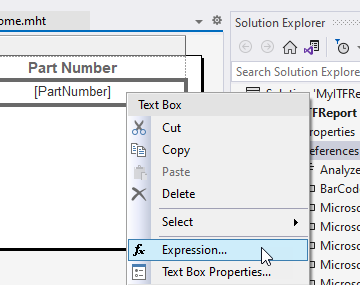
- Edit the Expression:
- =Code.MyITF.ITF( Fields!PartNumber.Value )
- Click OK
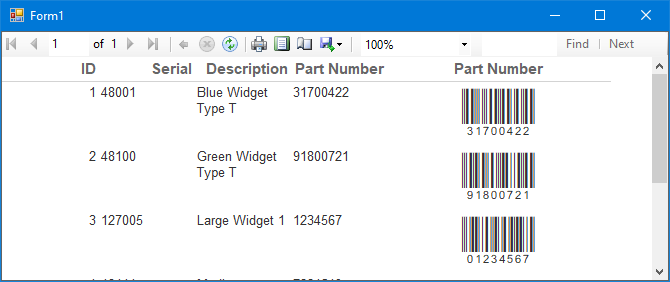
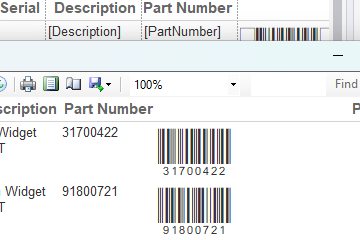
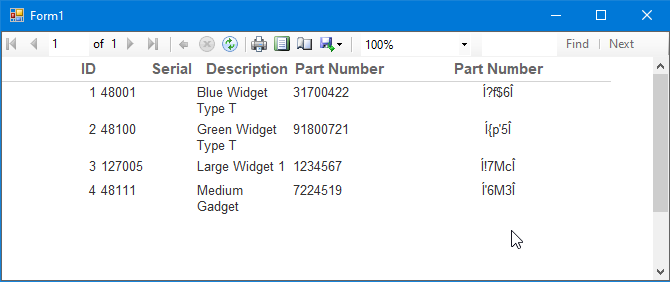
- Test your Report
- Click Start Without Debugging or press CTRL + F5
- You should see a report similar to the screenshot
Step 9. Set the font
- Change the font to BCW_i25h_2
- Set point size to 22
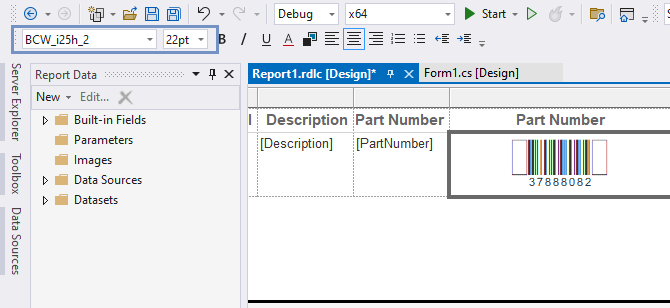
The Report is ready!
- Click Start Without Debugging or press CTRL + F5 to preview it