Create Data Matrix Barcodes in MS Access
Data Matrix Barcodes in Access
- This tutorial shows how to add Data Matrix barcodes to your MS Access reports. The barcodes are generated using BarCodeWiz Data Matrix Fonts.
- See the video or simply follow the steps below.
Step 1. Import module with barcode functions
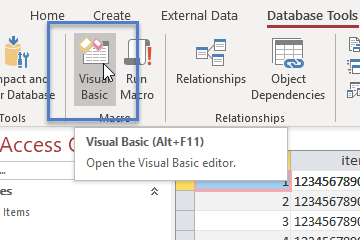
- Click on Database Tools tab > Visual Basic (or press Alt + F11).
- Right-click the database and Import File....
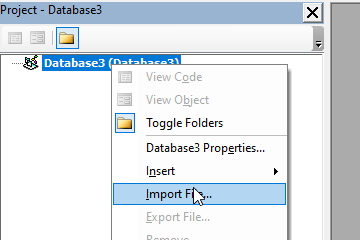
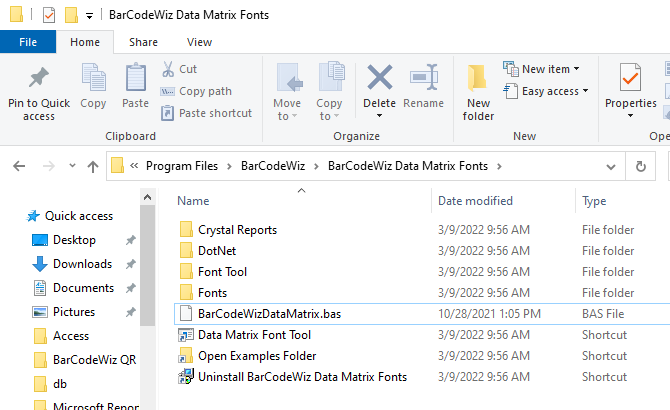
- Select BarCodeWizDataMatrix.bas.
- The default location of the file is:
Program Files\BarCodeWiz\BarCodeWiz Data Matrix Fonts\BarCodeWizDataMatrix.bas
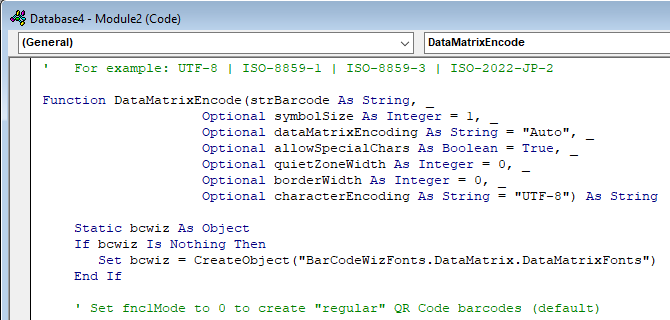
- The following module should now be part of the Access file.
Step 2. Create a new table (or use an existing table)
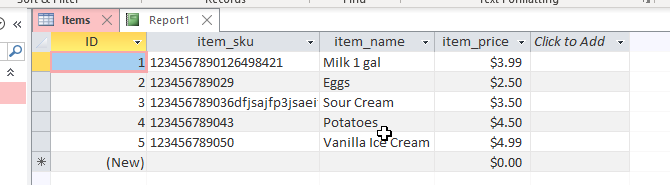
- Create a new table with barcode data. Name the table Items (or simply use an existing table). Our table has the following data:
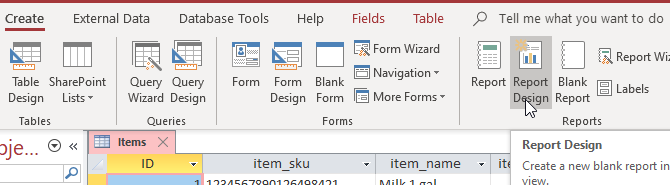
Step 3. Create a new report in Design Mode
- Click on Create tab > Report Design
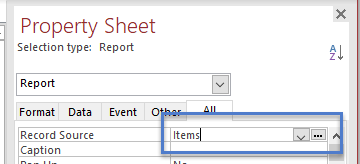
Step 4. Set Record Source of the report
- Go to report Properties window and set the Record Source property to Items (the name of our table from step 2).
Important: Never use the same name for text box as your table field's name.
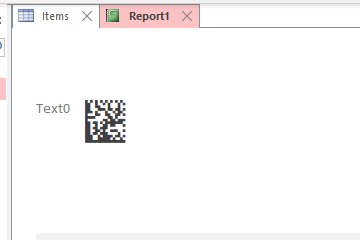
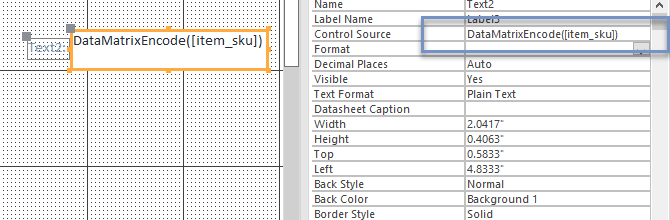
Step 5. Insert a TextBox for Barcode into the Detail section or the report. Set these properties:
- Control Source: =DataMatrixEncode([item_sku])
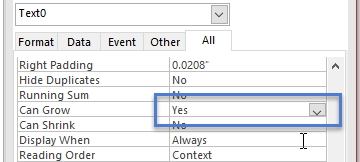
- Can Grow: Yes
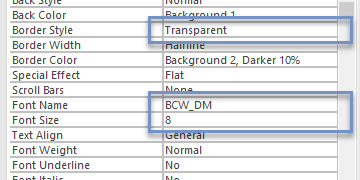
- Border Style: Transparent
- Font Name: BCW_DM
- Font Size: 8
NOTE: For smaller barcodes, you can set the point size as low as 2pt
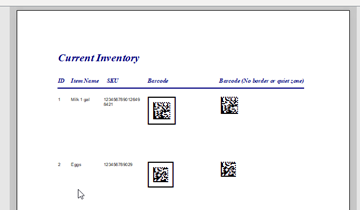
Step 6. Print or Print Preview the report.
- The report is ready to save or print.